EU’s Material
Footprint
EU’s material footprint amounted to 14.5 tonnes per capita in 2018. That is the raw material consumption reached in EU to satisfy our household, business and public sector needs.

Materials Categories
EU Material Footprint
EU Ecological Footprint
The sectors such as renewable energy, e-mobility and defence & space are well positioned for unprecedented growth in the coming years, which consequently will have a significant impact on the resource demands. For example, to achieve the climate and energy objectives, it is expected that the EU’s demand for certain raw materials will increase by a factor of 20 by 2030.
Critical Raw Materials Resilience Report
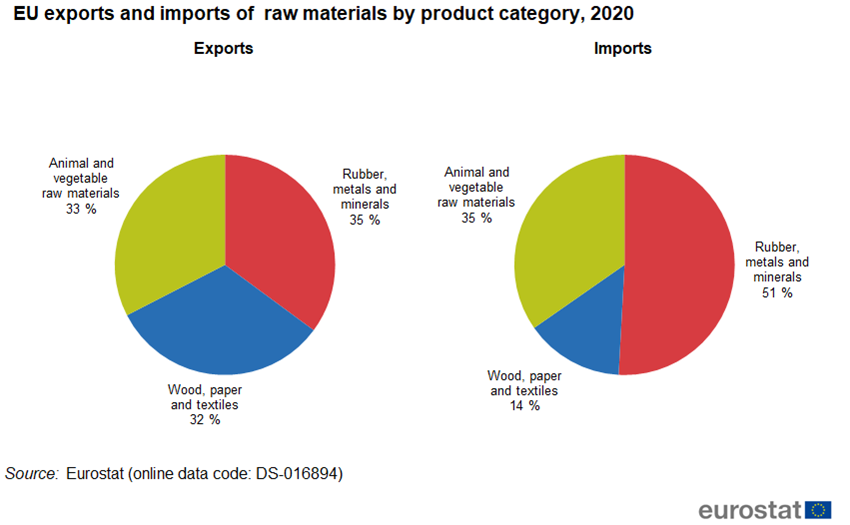
European economy is a net importer of fossil energy materials, metals and some biotic raw materials, and a net exporter of specific non-metalic minerals and roundwood. Import reliance is very mixed for different materials and stages in the value chain. A wide variety of EU industries depend on the secure supply of raw materials, typically in a diversified mix of imports, domestic extraction, secondary materials.
The EU is the third largest producer of industrial minerals and industrial roundwood. Its share in global production is low for iron and ferro-alloys, non-ferrous metals and precious metals. Trade networks for most raw materials are global and complex.
Figure 8: EU exports and imports of raw materials by main partner, 2020
To stimulate investment, innovation and competitiveness of EU economy, the EC has developed the Raw Material Information System (RIMS), a web-based knowledge platform on raw materials.


